Now let’s think for a minute about some of the Enterprise hardware that Cisco offers..it’s Catalyst switches, ISR routers, ASA firewalls and Wireless controllers. There is a lot of hardware that is up and running right now which doesn’t support new protocols like OpenFlow.
If you want to start using SDN, you could wait and replace your hardware with new toys that do support some form of SDN but Cisco thought of something else…
APIC-EM is an SDN controller that was created for Enterprise hardware. It uses a REST API for the northbound API with a decent GUI. For the southbound interface, it uses common protocols like Telnet, SSH and SNMP to communicate with your hardware.
The control / data plane remains in your switches, routers, and other devices. APIC-EM is not an SDN controller that replaces the control plane.
What does it do then? It has a couple of cool features:
- Collects information about the entire network: interface statistics, VLANs, routing protocols.
- Builds topology pictures.
- Allows you to send configurations to all your devices.
- And more.
Don’t confuse APIC with APIC-EM. APIC is the name of the SDN controller that Cisco uses for its ACI solution.
Installation
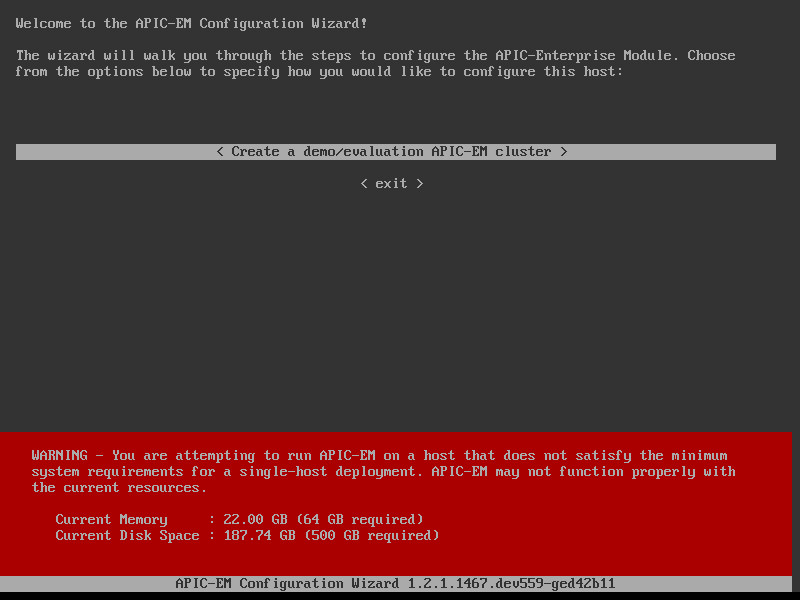
Cisco offers an ISO image that you can download to install APIC-EM on your own hardware or in a virtual machine. You will need a CCO account but it doesn’t require a contract or anything.It does have some hefty hardware requirements. It needs 6 CPU cores with 2.4Ghz at least, 64GB of RAM and a 500GB hard disk for a production install.
Fortunately, it does allow you to install with less hardware for evaluation. If your machine has between 16 and 25GB of RAM then it will detect this and offers you to install an evaluation install.
I also highly recommend you to check out Cisco’s DevOps. They offer some APIC-EM labs so you don’t have to install anything yourself.
Having said that, let me show you how to install APIC-EM. I created a new virtual machine with the following properties:
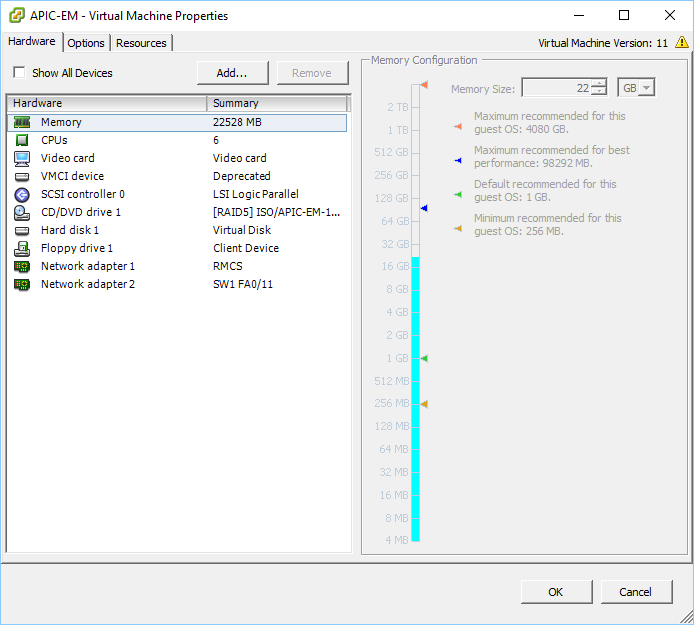
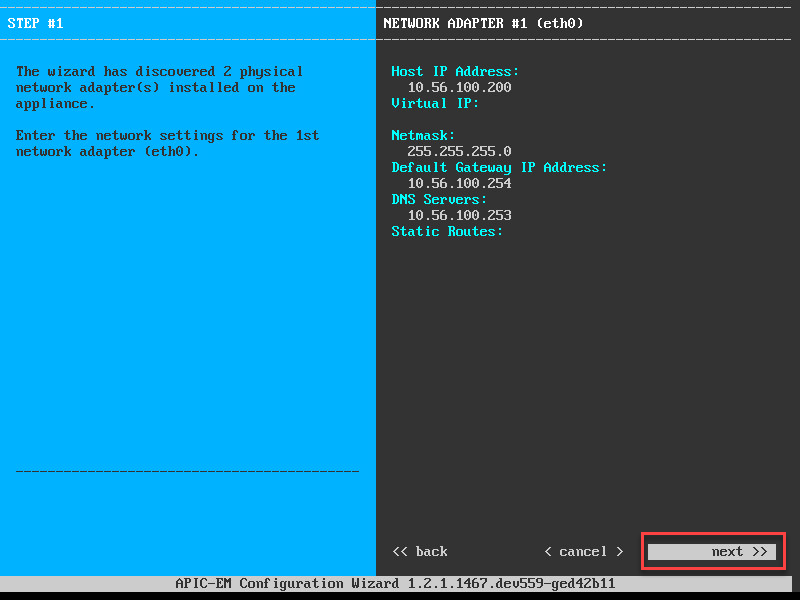
My virtual machine has 22GB of RAM and two network interfaces. One will be used as the northbound interface so that I can access the controller. The second network interface is used as the southbound interface to reach my network.
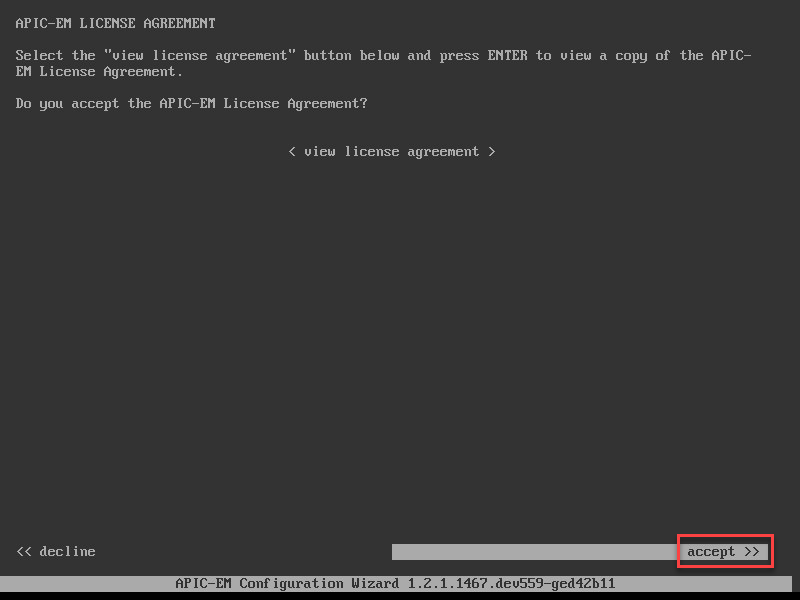
Once you boot the ISO, it will show a license agreement:
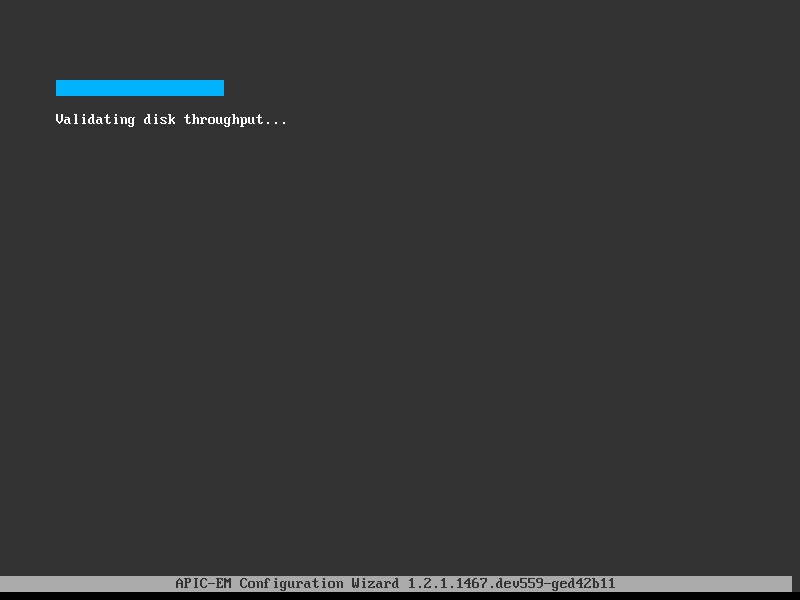
Let’s accept it, APIC-EM will now check the disk throughput:
You require 200 MB/s for a production installation. APIC-EM will warn you about this:
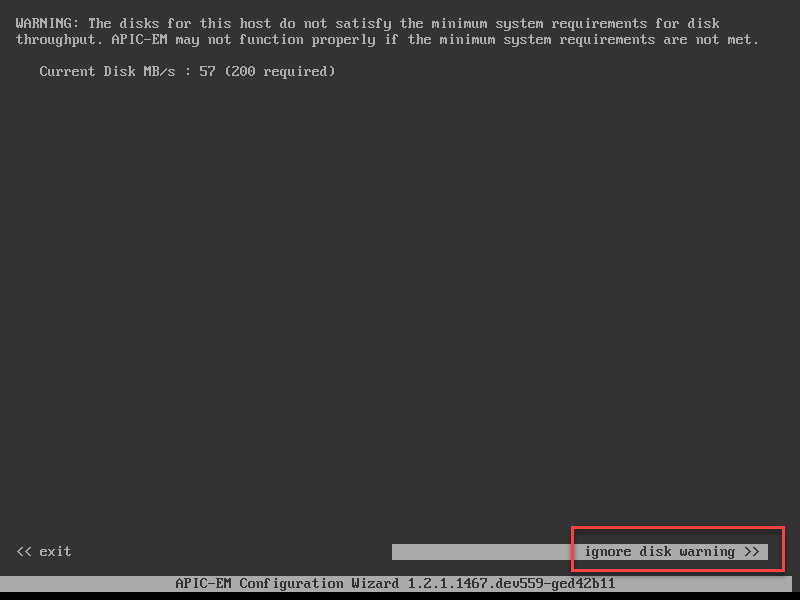
Just ignore the warning and continue. Since I am using 22GB of RAM, APIC-EM will suggest to create a demo / evaluation installation:
Let’s continue and configure the first network adapter:
And here’s the second network interface:
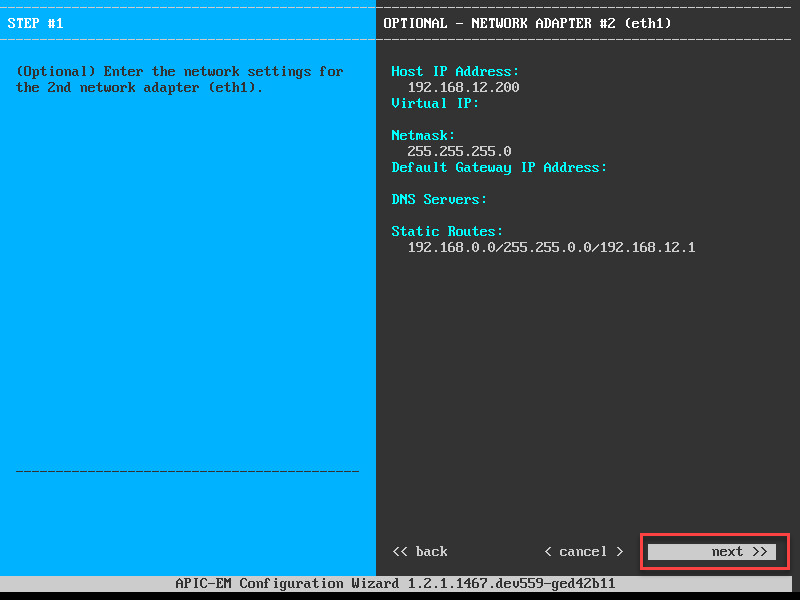
For my second network interface, I added a static route so that APIC-EM can reach all my network devices in the 192.168.0.0/16 range.
Hit Next and it will ask you for your CCO account:
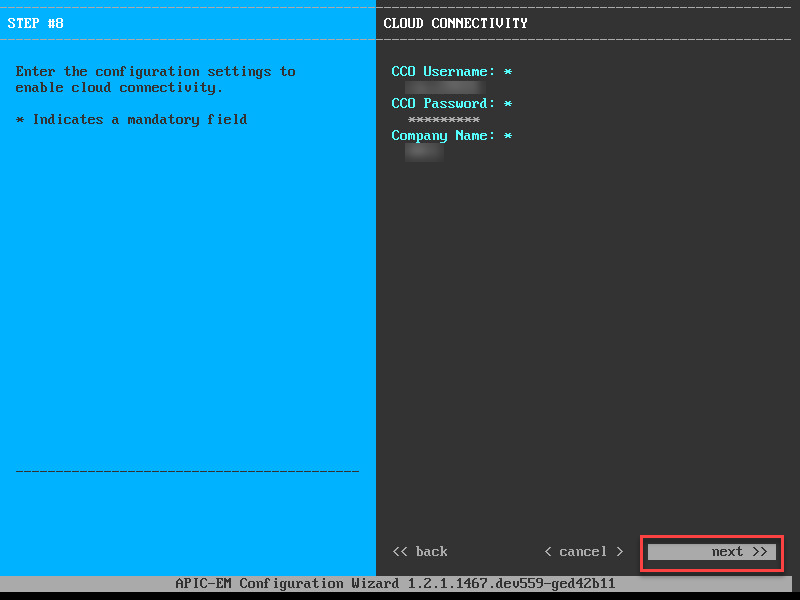
Enter your credentials and continue. Time to create a Linux user account:

The credentials above are needed when you want to SSH into the box or if you want to look into Grapevine (I’ll show you this later).
We need one more user account:
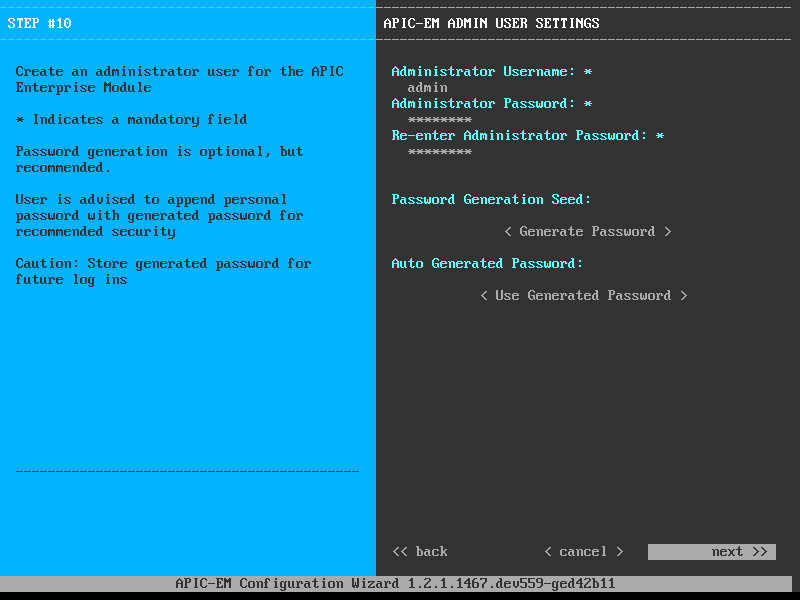
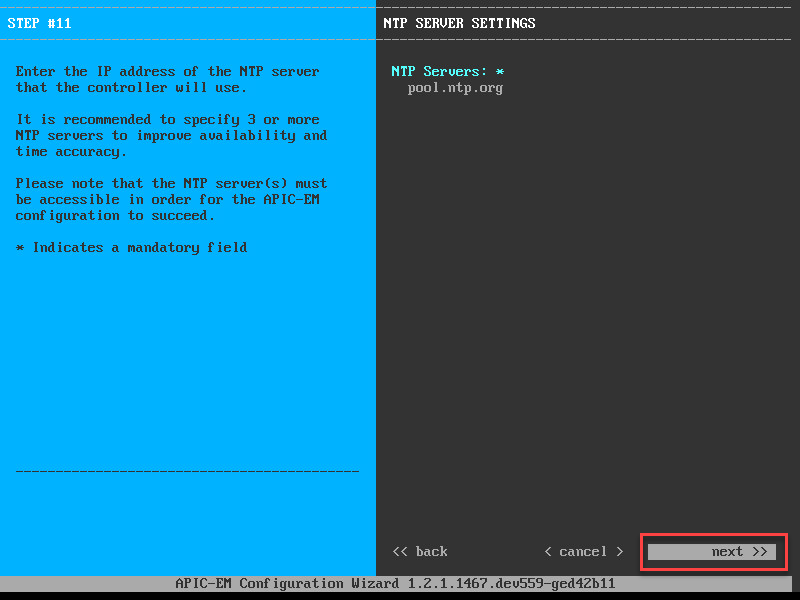
The admin account is needed to access APIC-EM. Let’s continue and set a NTP server:
If you run a multi-host cluster, you can configure IPSec between the hosts:

We only have one host so you can keep IPSec disabled. Let’s continue:

This is a fresh installation so we don’t have to wipe any data. The wizard is now ready:
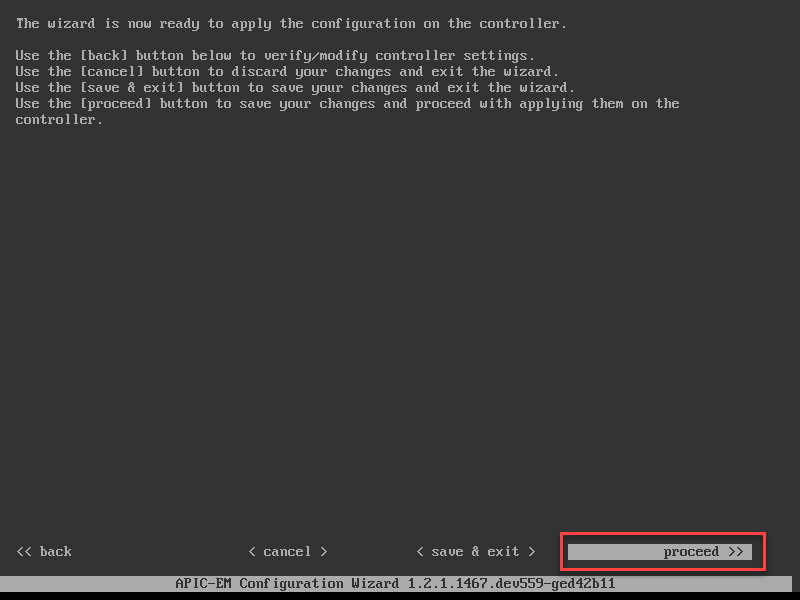
Once you click proceed, grab some coffee…it will take a LONG time before everything is installed and all services are running. You can see the progress on the console:
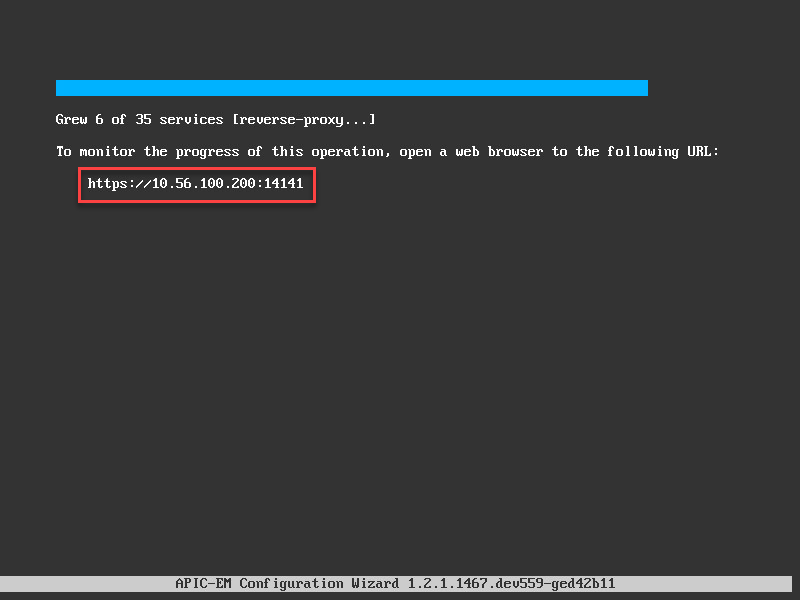
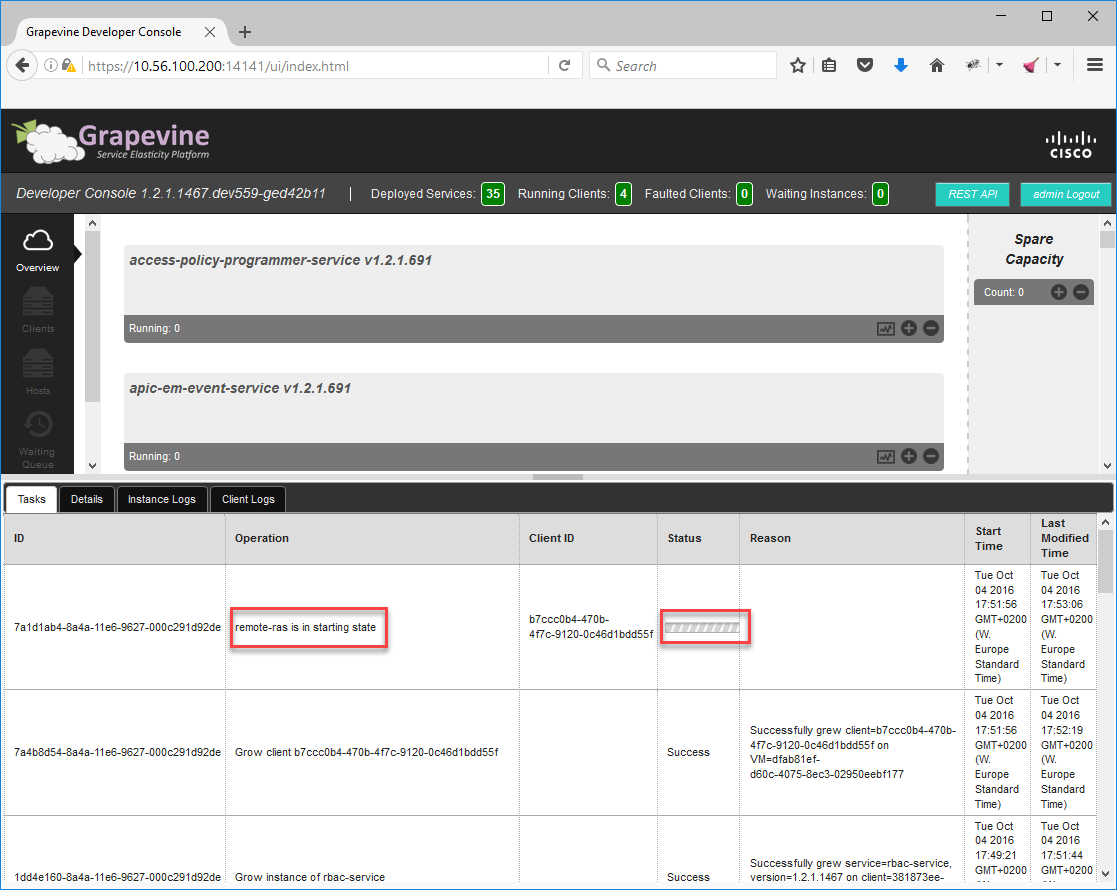
It also gives you a URL where we can see its progress. Let’s give it a try:
You can use the admin account that we created in the wizard. Once logged in, you will see all services that are starting:
Once all services are started we can take a look at APIC-EM. Start your web browser again and enter the IP address of your northbound interface without a port number:
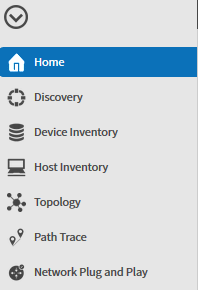
You can use the admin account to login. Once you are logged in, you’ll see the menu on the left side:
APIC-EM is now up and running. Before we can do anything, we will have to add some network devices…
Discovery
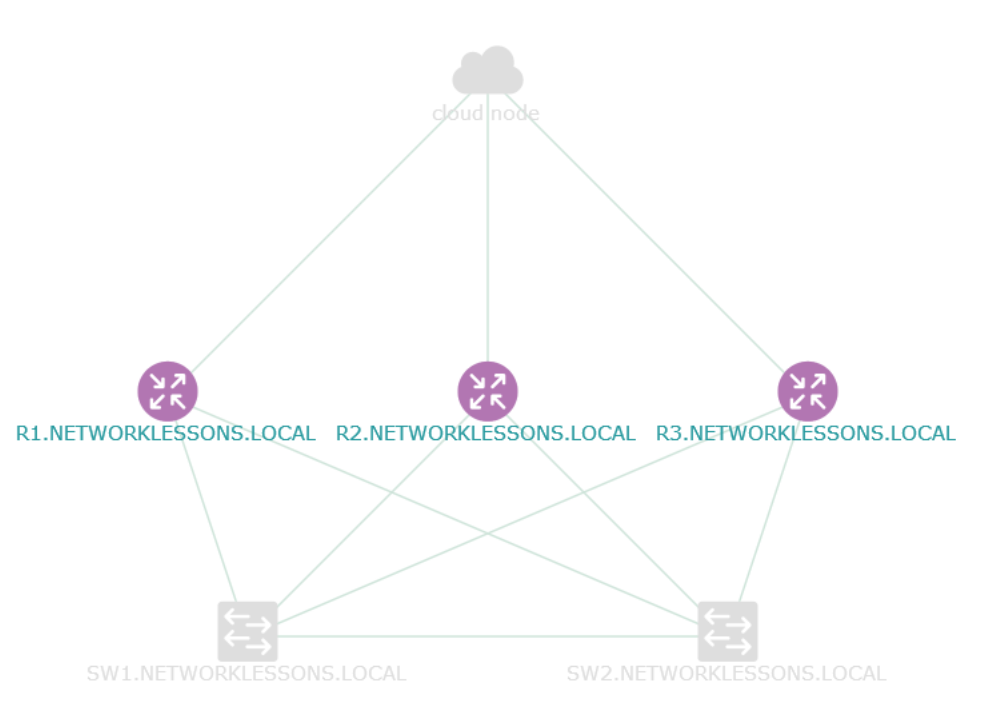
We will need some network devices that APIC-EM can control. I will use the following physical topology for this: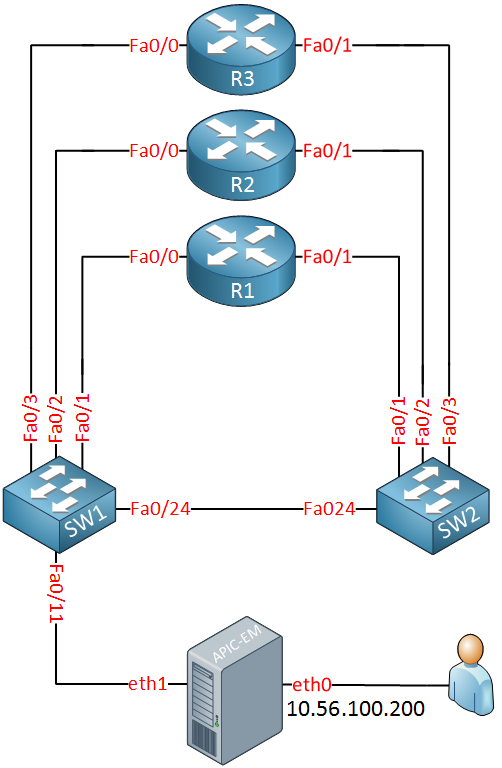
Above we have three routers and two switches. At the bottom, we see the APIC-EM server with its two network interfaces. eth1 will be connected to our network and eth0 is used to access the APIC-EM servers.
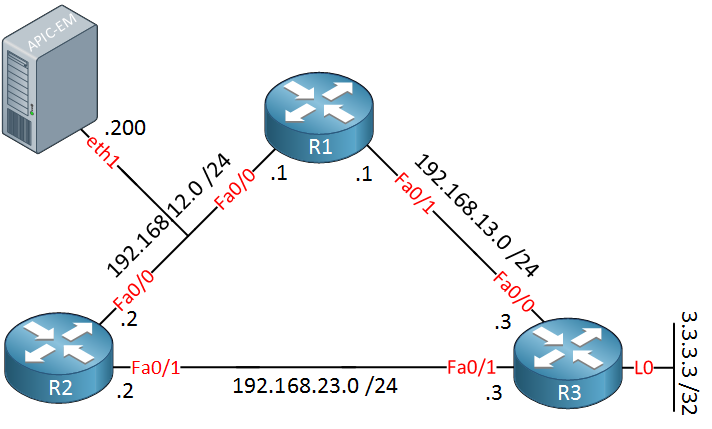
I will use the physical topology above to build the following logical topology:
Want to take a look for yourself? Here you will find the startup configuration of each device.
APIC-EM allows us to discover devices on the network. It will use CDP, SSH (or Telnet) and SNMP for this. Since SSH and SNMP require some credentials, it’s best to configure these globally.
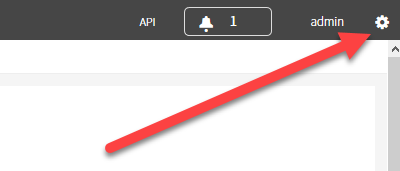
In the top right corner, click on the “gear” icon and select “settings” :
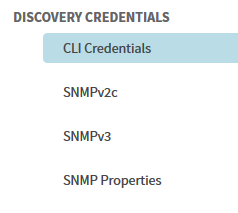
Look for the discovery credentials section in the menu on the left side:
It will show you the following screen:
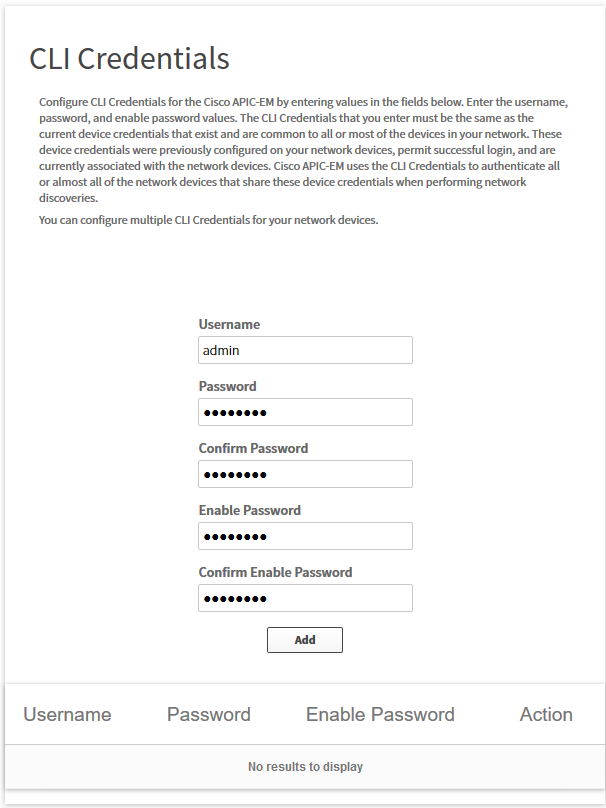
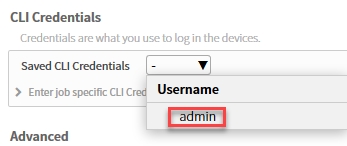
Here we can enter our username and password that we use for SSH and the enable password. Click on the Add button.
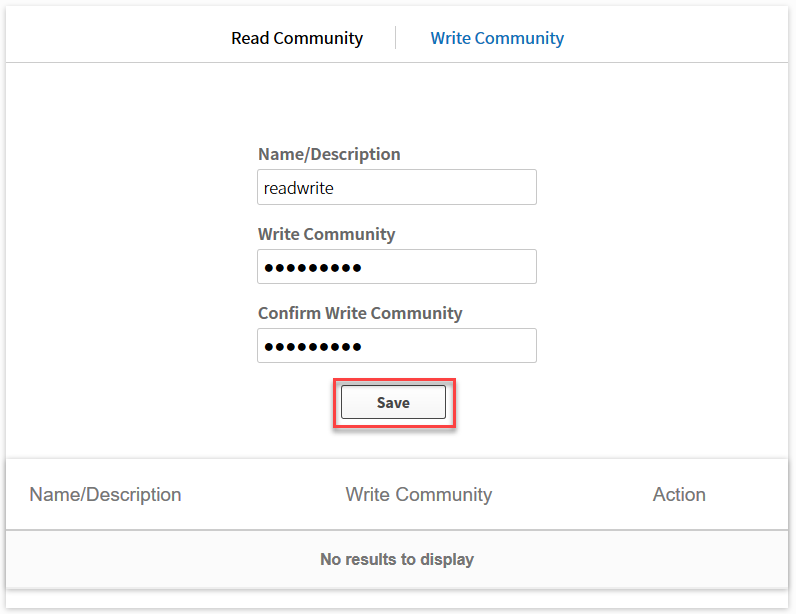
We will continue by selecting SNMPv2c in the menu. You will see this screen:
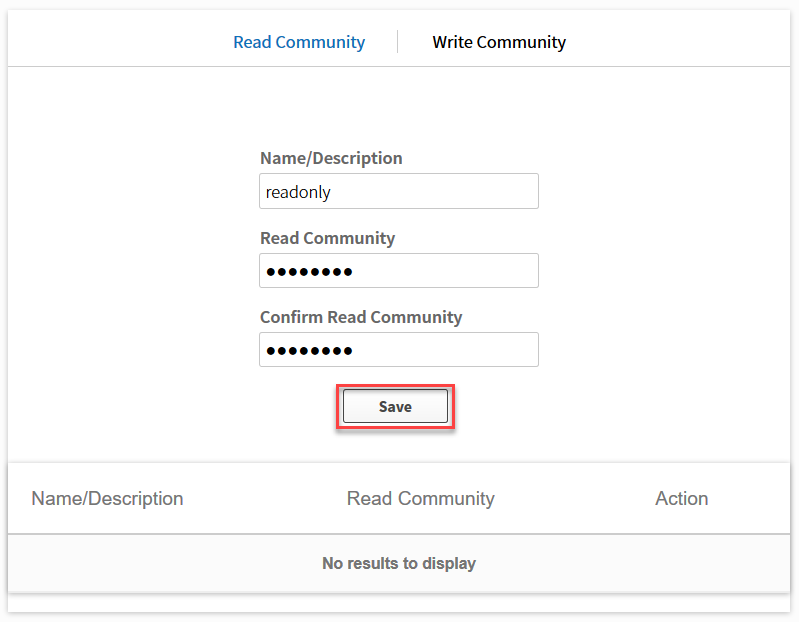
Let’s configure a read only SNMP community. Click on the save button and don’t forget to configure the write community as well:
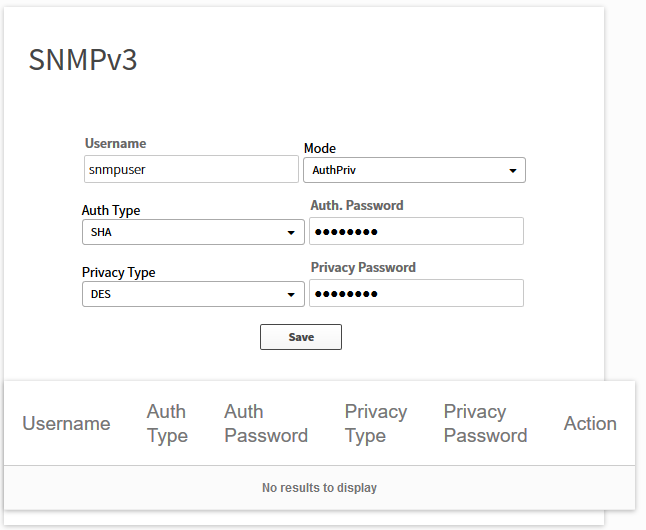
Optionally, you can also add your SNMPv3 settings if you use it:
Our APIC-EM controller now knows the credentials it has to use for SSH and SNMP.
Time to discover the network. On the left side, select the discovery icon:
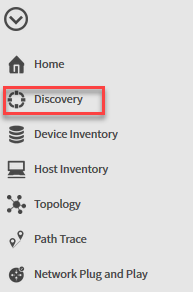
Here we can add a new discovery. You can enter the IP address of a single device here and APIC-EM will use CDP to find other network devices. You can also enter a range of IP addresses to scan.
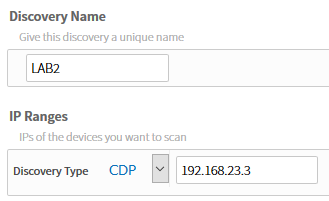
Let’s start with something simple, I’ll call my discovery “LAB2” and enter one of the IP addresses of R3:
Since we already configured our credentials for SSH and SNMP, we can select them below:
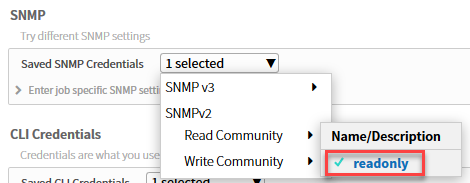
Make sure you select both the read and write community:
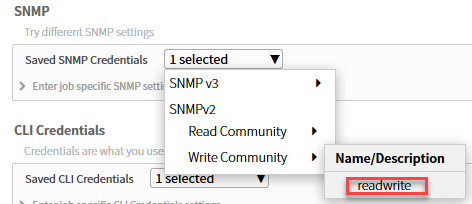
And select our SSH credentials:
Now hit the discovery button and wait for the magic to happen:
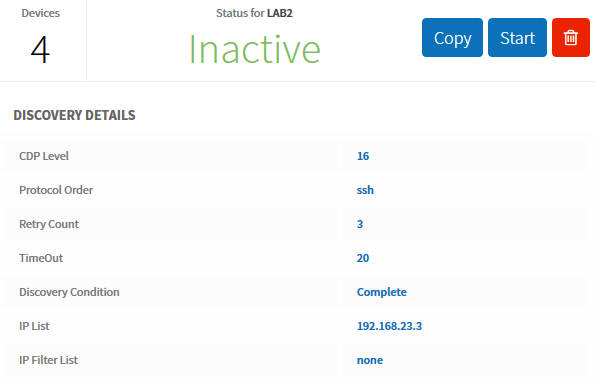
After a sip of coffee, APIC-EM shows me all devices that are found:
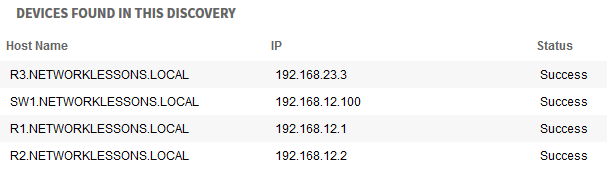
In my case, it detected four of my network devices. SW2 is not showing up in this discovery. I had to run another discovery with the IP address of SW2 to make it show up.
Make sure all your network devices have
been discovered by APIC-EM. The first time, I skipped SW2 since I was
only using it to connect two routers to each other. If you skip some
devices, your topology pictures will be incorrect and path trace results
will be incomplete.
Inventory
Once all devices are discovered, we can check the device inventory. In the menu on the left side, select Device Inventory: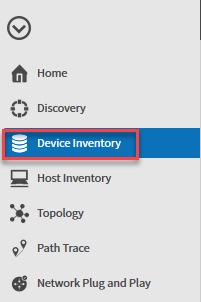
You will now see the following screen:
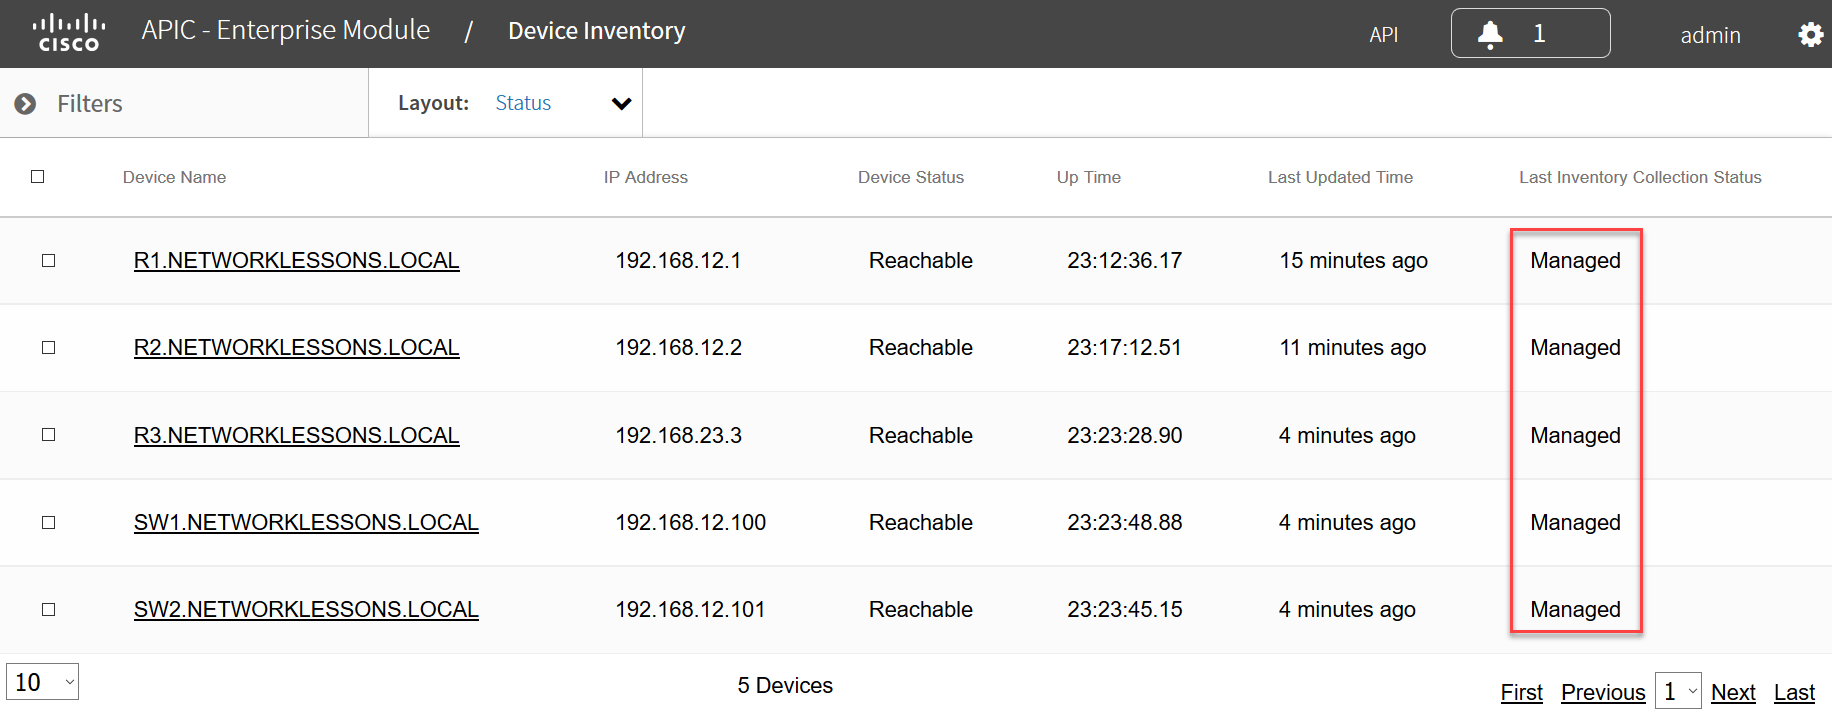
Above you can see that all my devices have been detected. The most important part in this overview is that all devices show up as managed. If any of your devices show up as partial collection, make sure that your credentials are 100% OK. Try another discovery with other credentials
Try another discovery with other credentials. Give APIC-EM some time, you can see the last updated time which was 4-15 minutes ago. Make sure everything shows up as managed before you continue.
You can click on any of these devices to get some more information. Here’s R1:
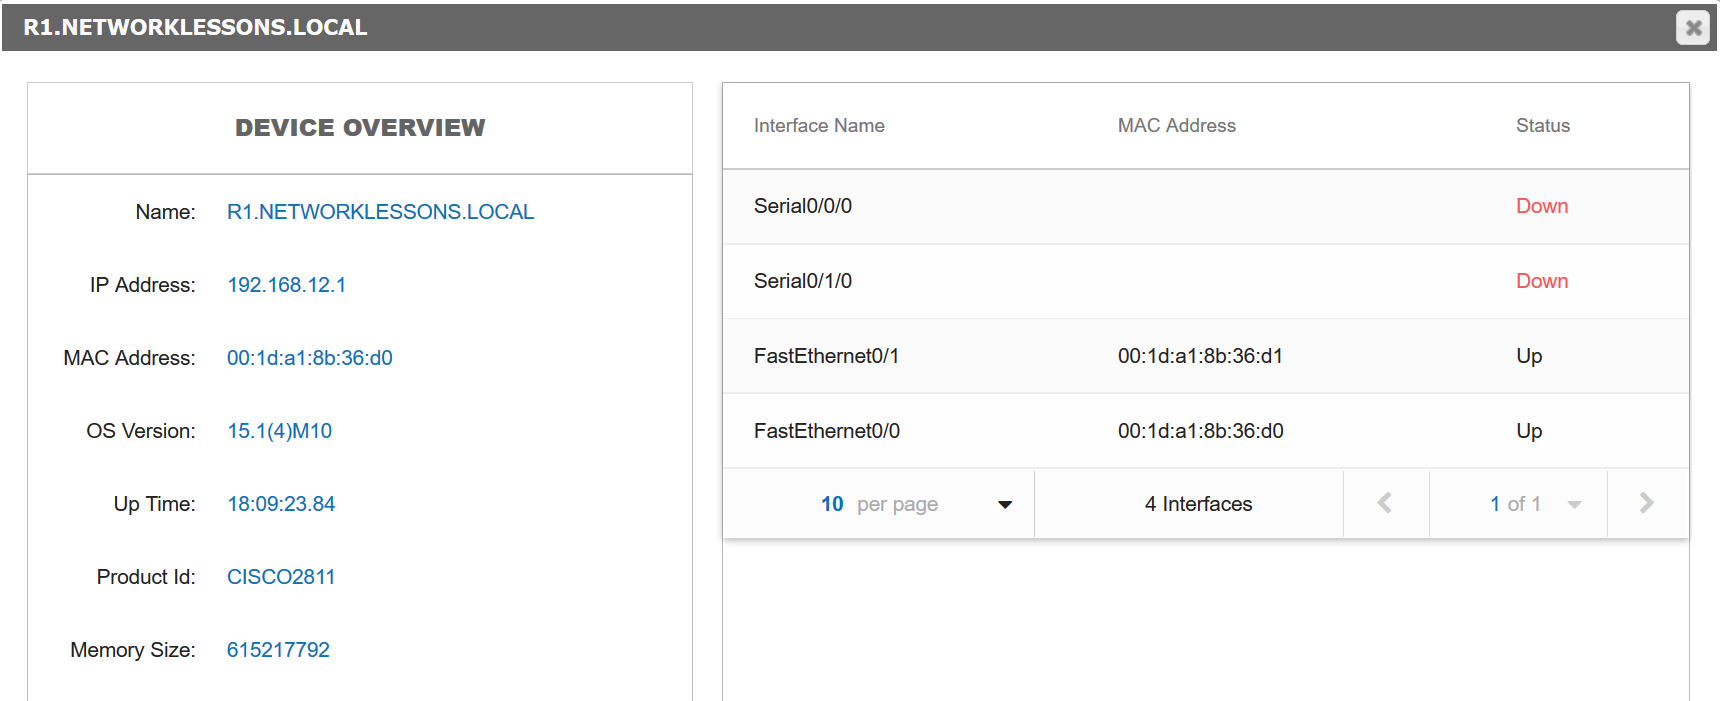
It shows me the platform, IOS version, interfaces etc. If you click on the Layout button, you can also select some other things. For example, the location:
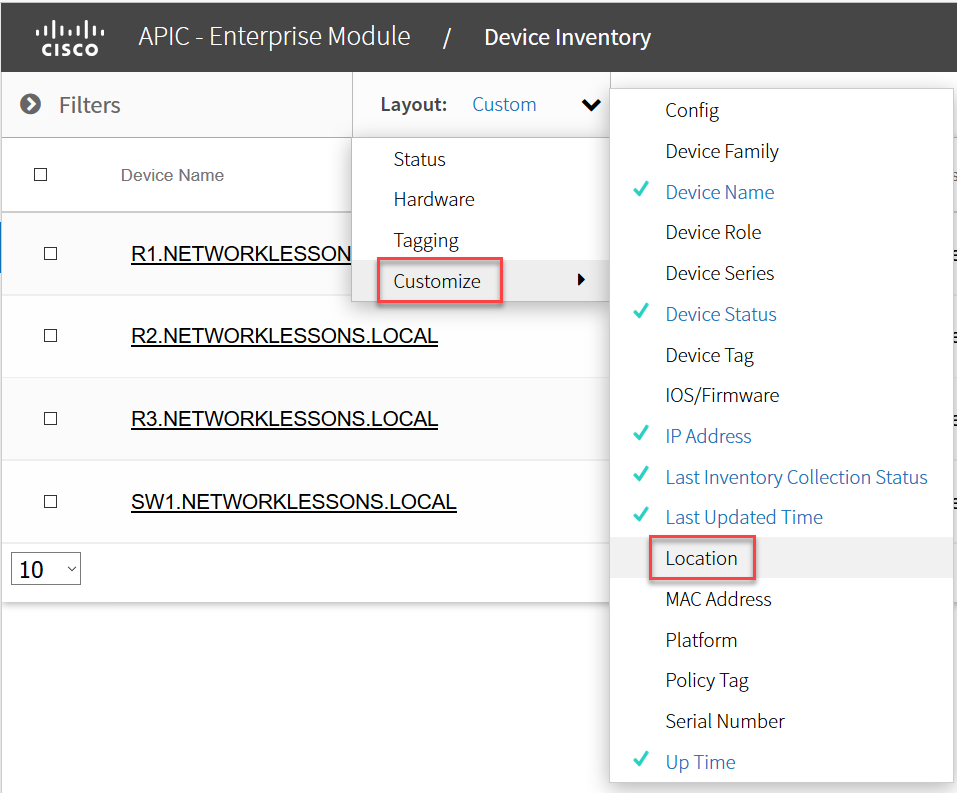
A new column will show up where you can add the location:

Let’s give it a try. Let’s say that R1 is located in Amsterdam (The Netherlands):
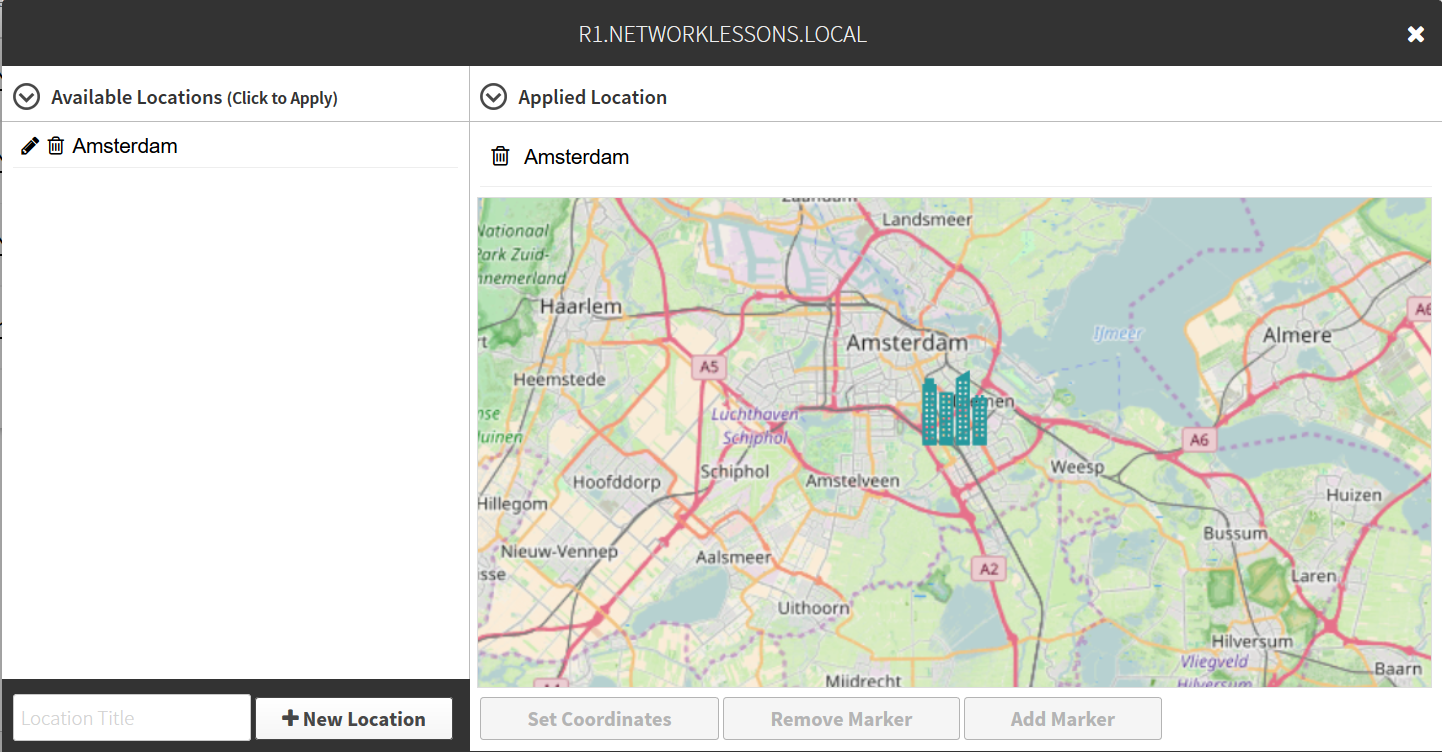
You can do this for each of your network devices if you want. You can also add a button in the layout that shows you the running configuration:
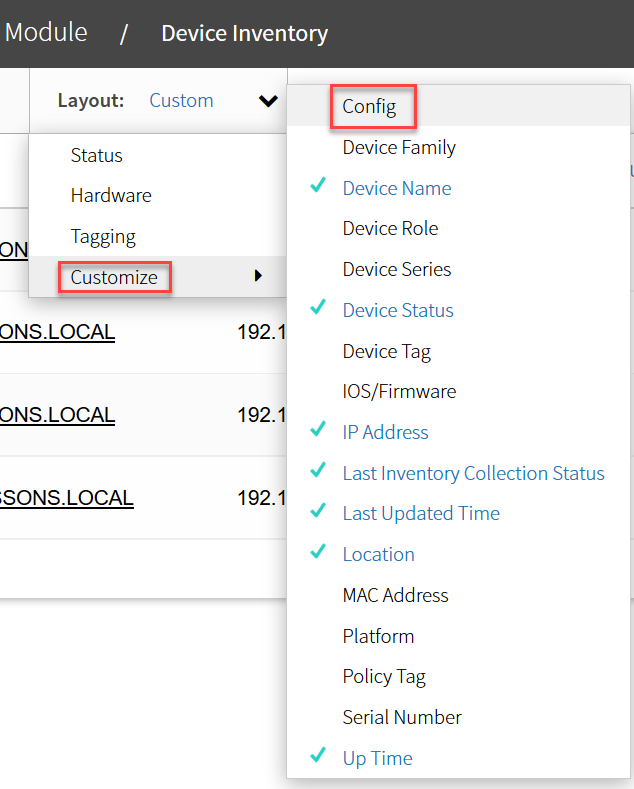
Select the location button and a new column will appear:

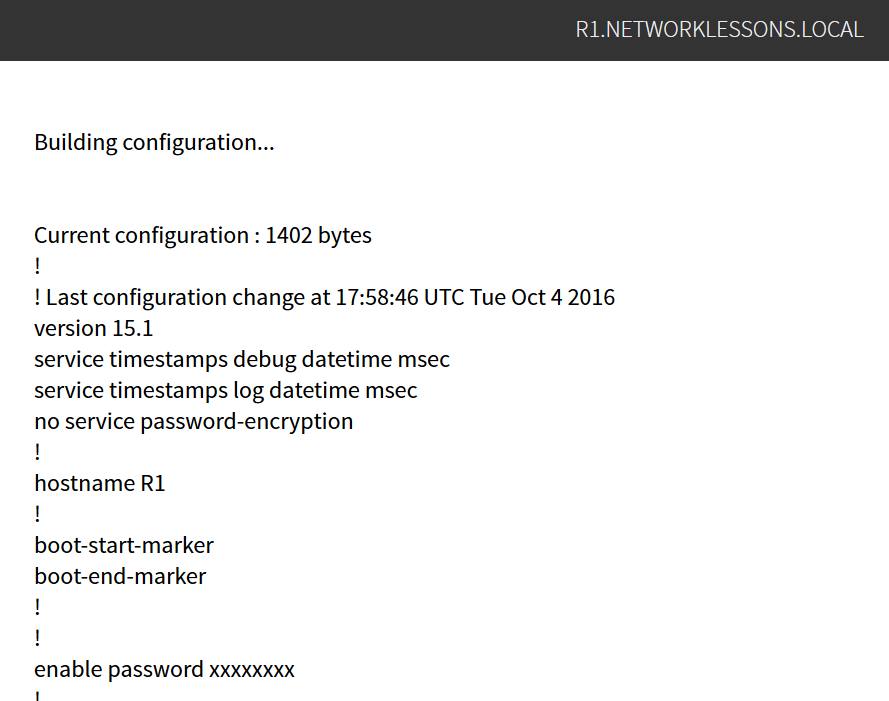
Once you click on the view button, you’ll see the running configuration:
It’s best to play around a bit with the different options to see this for yourself.
Topology
All network devices are discovered and APIC-EM is managing all of them. Let’s take a look at the Topology, in the left menu, click on Topology: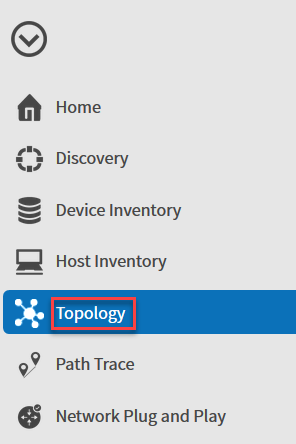
It will show you the following topology:
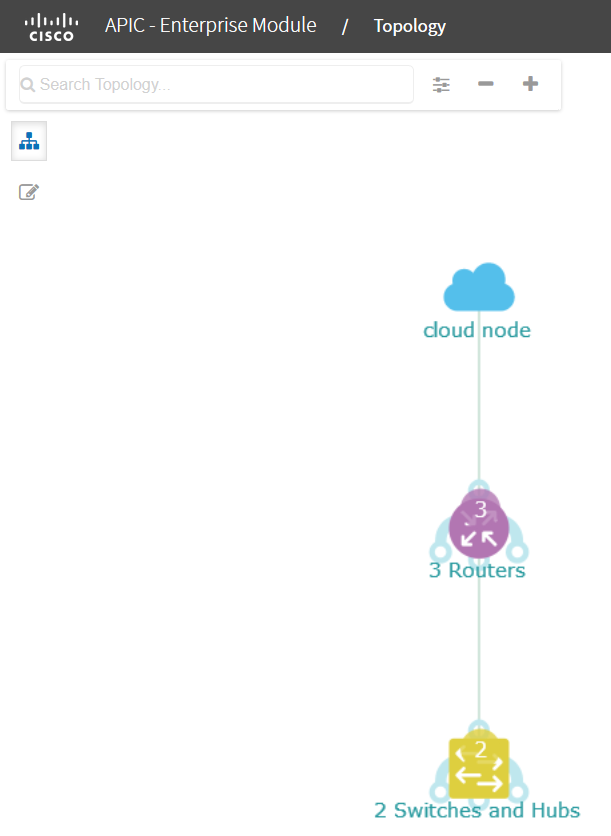
The picture above doesn’t make much sense since it puts all switches and routers on top of each other. If you click on the devices, you can Disaggregate them:
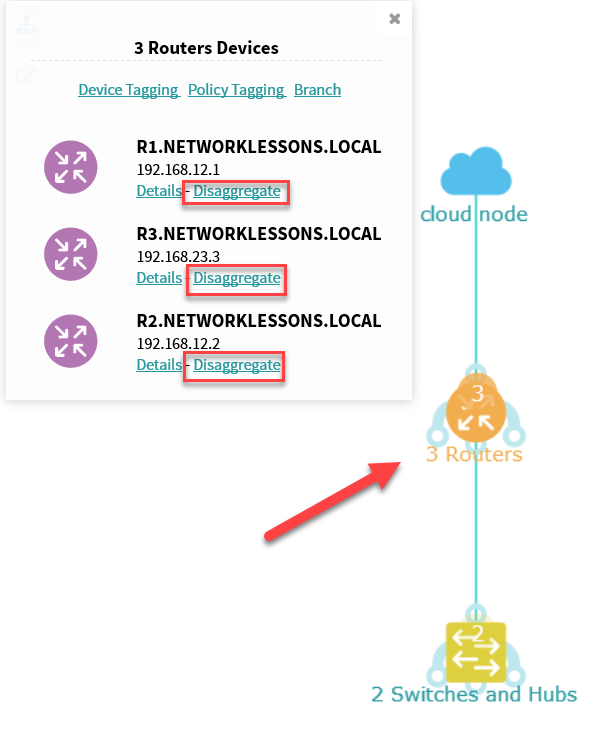
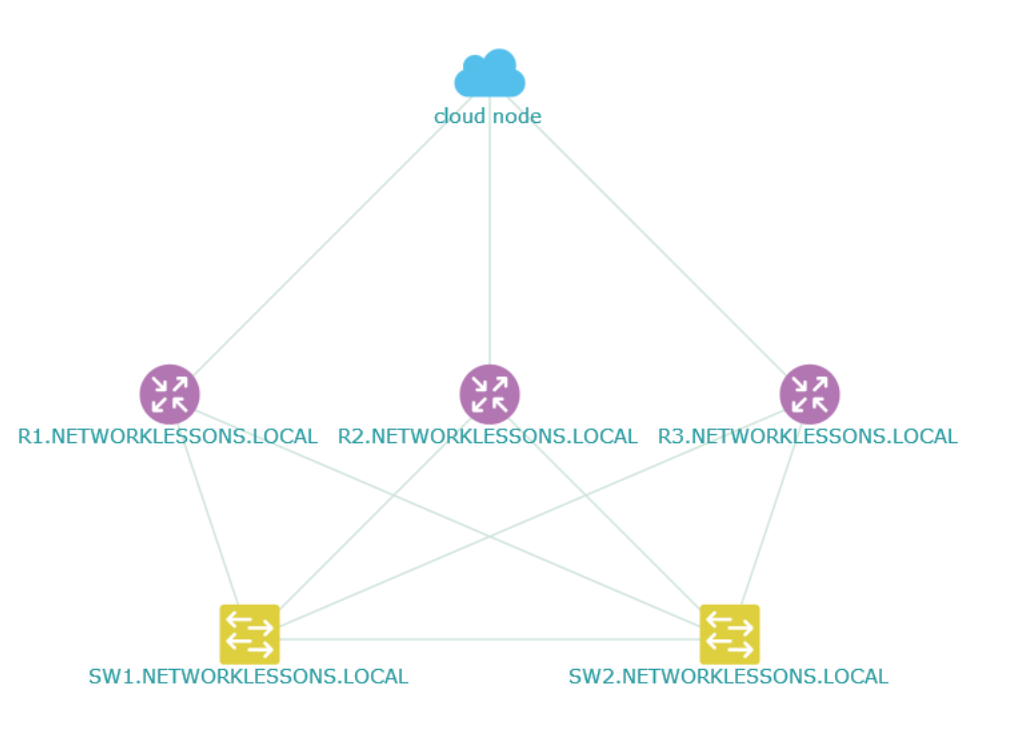
The new topology looks a bit better:
One of the things you can do in the topology view is filtering. Click on the Layering button on the top right side:
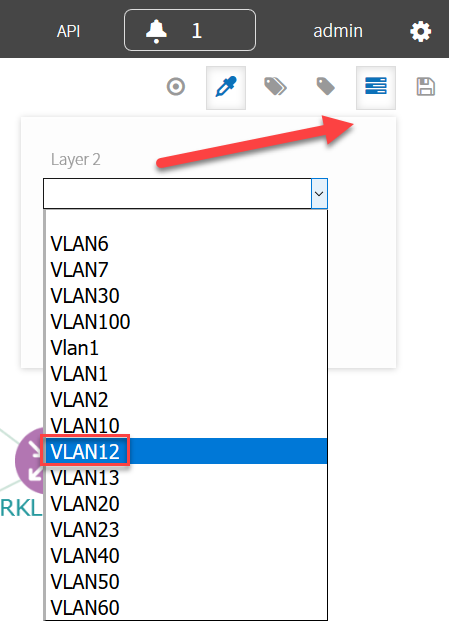
Under Layer 2, select one of your VLANs. I’m using VLAN12 to connect R1 and R2 to each other. Here’s what you will see:
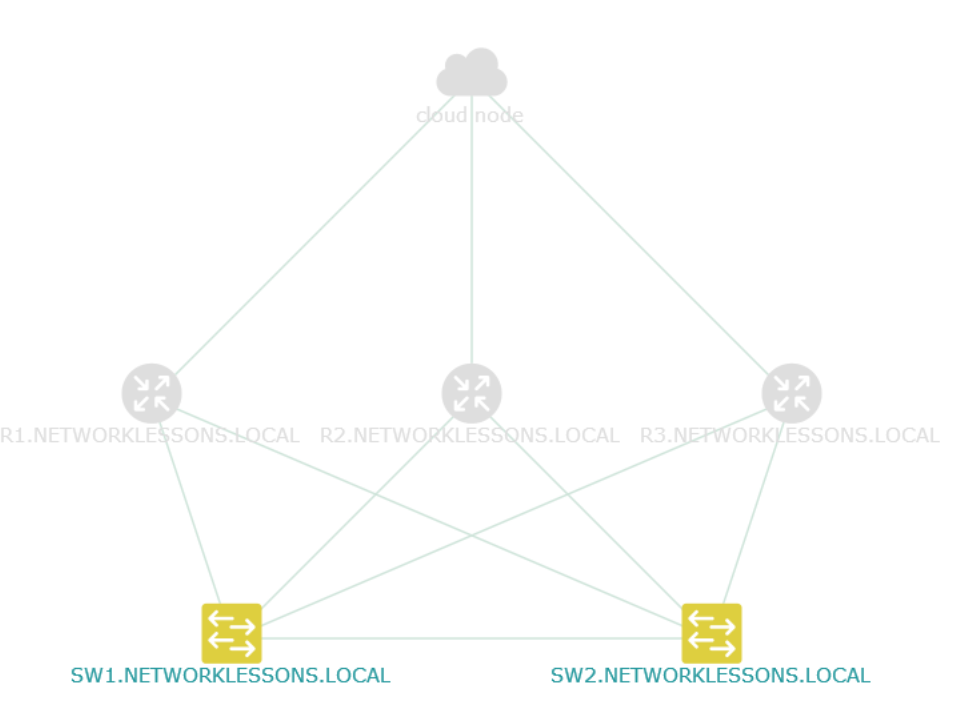
Above you see all devices where VLAN 12 is configured, SW1 and SW2 in my case. You can also use layer 3 options. Let’s select OSPF:
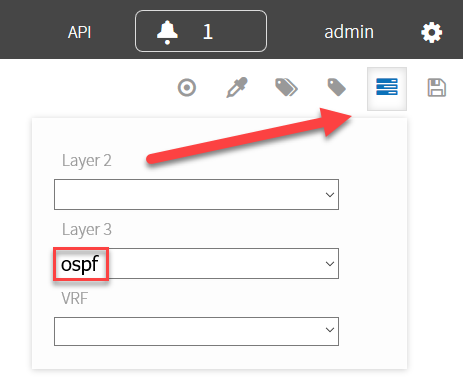
The topology now shows all devices that are configured with OSPF:
API
I showed you some of the GUI options but APIC-EM wouldn’t be an SDN solution if it didn’t have an API.APIC-EM uses a REST API and it allows you to use fetch information or configure the controller.
To show you an example, I grabbed a python script from Cisco DevNet and modified it a bit. Don’t worry too much about what the script looks like, it’s just to give you an idea of how we can access the controller. Here’s the script:
import requests
import json

requests.packages.urllib3.disable_warnings() # Disable warnings

# Controller settings
CONTROLLER_IP="10.56.100.200"
USER = "admin"
PASS = "Cisco123"
GET="get"
POST="post"

def getServiceTicket():
    ticket=None
    payload = {"username":USER,"password":PASS}

    #This is the URL to get the service ticket.
    url = "https://" + CONTROLLER_IP + "/api/v1/ticket"

    #Content type must be included in the header
    header = {"content-type": "application/json"}

    #Format the payload to JSON and add to the data.  Include the header in the call.
    response= requests.post(url,data=json.dumps(payload), headers=header, verify=False)

    #Data received.  Get the ticket and print to screen.
    r_json=response.json()
    ticket = r_json["response"]["serviceTicket"]
    return ticket

#Make the REST call using the service ticket, command, http url, data for the body (if any)
def doRestCall(aTicket,command,url,aData=None):

    response_json=None
    payload=None

    #if data for the body is passed in put into JSON format for the payload
    if(aData != None):
       payload=json.dumps(aData)

    #add the service ticket and content type to the header
    header = {"X-Auth-Token": aTicket, "content-type" : "application/json"}
    if(command==GET):
       r = requests.get(url, data=payload, headers=header, verify=False)
    elif(command==POST):
       r = requests.post(url, data=payload, headers=header, verify=False)
    else:
       #if the command is not GET or POST we dont handle it.
       print ("Unknown command!")
       return

    #if no data is returned print a message; otherwise print data to the screen
    if(not r):
        print("No data returned!")
    else:

       #put into dictionary format
       response_json = r.json()
       device_list = response_json['response']

       try:
           for device in device_list:
               print 'Name of device: %s' % device['hostname']
               print 'MAC address of device: %s' % device['macAddress']
               print 'Device type: %s' % device['type']
               print '---'
       except:
            pass

#Call the function to get the service ticket
ticket=getServiceTicket()

#Get network device info in the system
doRestCall(ticket,GET, "https://" + CONTROLLER_IP + "/api/v1/network-device")

#Create a new application
doRestCall(ticket, POST, "https://" + CONTROLLER_IP + "/api/v1/topology/application",[{"id":"1","description":"cool app","name":"appABC"}])$ python apic-em-device-info.pyName of device: R1.NETWORKLESSONS.LOCAL
MAC address of device: 00:1d:a1:8b:36:d0
Device type: Cisco 2811VE Integrated Services Router
---
Name of device: R2.NETWORKLESSONS.LOCAL
MAC address of device: 00:17:5a:ed:7a:f0
Device type: Cisco 2811VE Integrated Services Router
---
Name of device: R3.NETWORKLESSONS.LOCAL
MAC address of device: 00:16:c7:be:0e:c9
Device type: Cisco 2811VE Integrated Services Router
---
Name of device: SW1.NETWORKLESSONS.LOCAL
MAC address of device: 00:19:56:9d:57:41
Device type: Cisco Catalyst 3560-24PS Switch
---Conclusion
You have now seen how to install APIC-EM, how to discover devices and we played a bit with the topology, device inventory and REST API.I have to say I have some mixed feelings about APIC-EM. The installation is pretty straight forward, GUI looks pretty slick and the API works well.
It took me a couple of tries to get all devices discovered and managed succesfully by APIC-EM. The annoying part is that sometimes you have to wait a couple of minutes for APIC-EM to do its magic.
n a previous lesson, I explained how to install APIC-EM and some of its basics. In this lesson, we’ll take a look at the path trace ACL analysis tool which is one of the topics on the blueprint of CCNA R&S.
I used this to build the following logical topology:
The routers above are running OSPF. Let’s see if we can trace some traffic.
hostname SW1
!
enable password Cisco123
!
username admin password 0 Cisco123
!
ip domain-name NETWORKLESSONS.LOCAL
!
interface FastEthernet0/1
 switchport access vlan 12
 switchport mode access
 spanning-tree portfast
!
interface FastEthernet0/2
 switchport access vlan 12
 switchport mode access
 spanning-tree portfast
!
interface FastEthernet0/3
 switchport access vlan 13
 switchport mode access
 spanning-tree portfast
!
interface FastEthernet0/11
 switchport access vlan 12
 switchport mode access
 spanning-tree portfast
!
interface FastEthernet0/12
 switchport access vlan 12
 switchport mode access
 spanning-tree portfast
!
interface FastEthernet0/24
 switchport trunk encapsulation dot1q
 switchport mode trunk
 ip access-group R1_R3_HTTP in
!
interface Vlan12
 ip address 192.168.12.100 255.255.255.0
!
ip default-gateway 192.168.12.1
ip classless
!
ip access-list extended R1_R3_HTTP
 deny   tcp host 192.168.13.1 host 3.3.3.3 eq www
 permit ip any any
!
snmp-server community readonly RO
snmp-server community readwrite RW
!
line vty 5 9
 login local
 transport input ssh
line vty 10 15
 login
!
end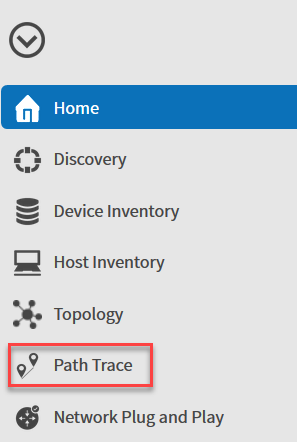
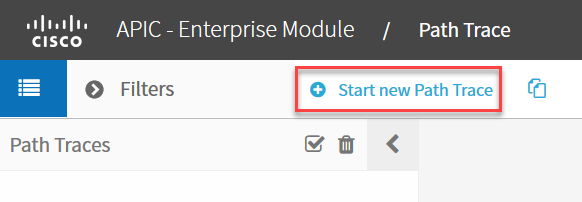
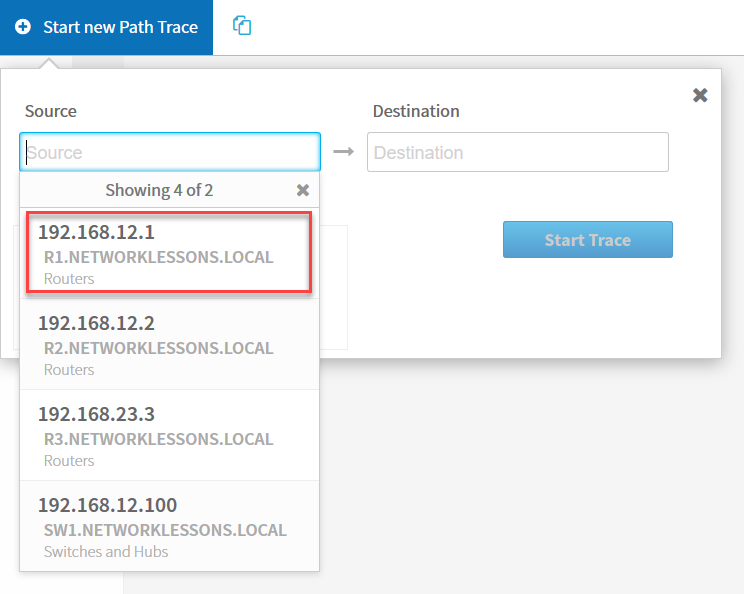
Select “Start new Path Trace”:
Now we can enter a source and destination. Let’s select R1 as the source:
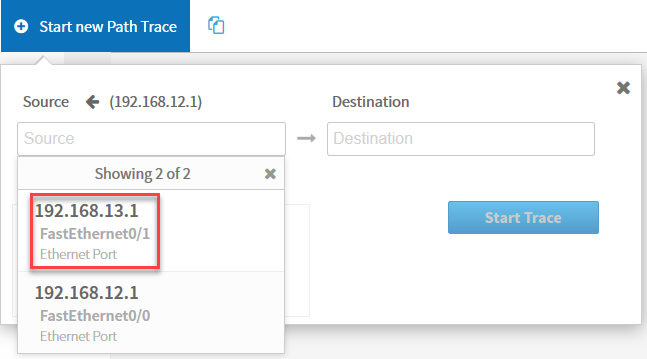
Once you select the device, you can select one of its interfaces. Let’s pick FastEthernet 0/1:
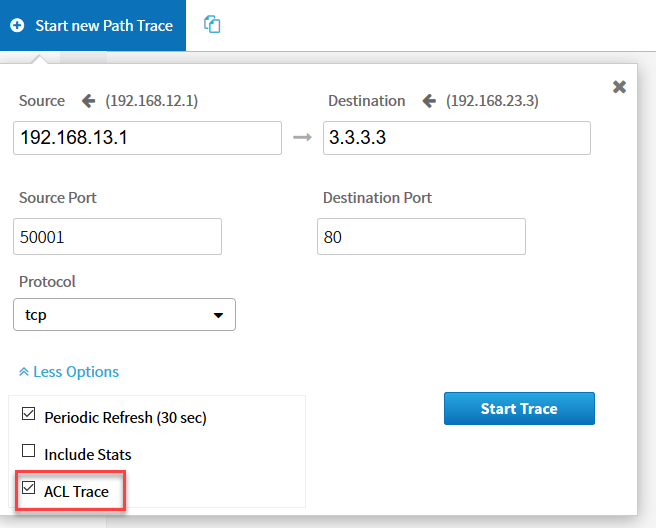
For the destination, we will use R3 and its loopback interface. We will select options and choose TCP as our protocol with destination port 80. For the source port, I’ll pick 50001. Make sure you select ACL trace:
Click on Start Trace and APIC-EM will do its magic. You will see the following screen:
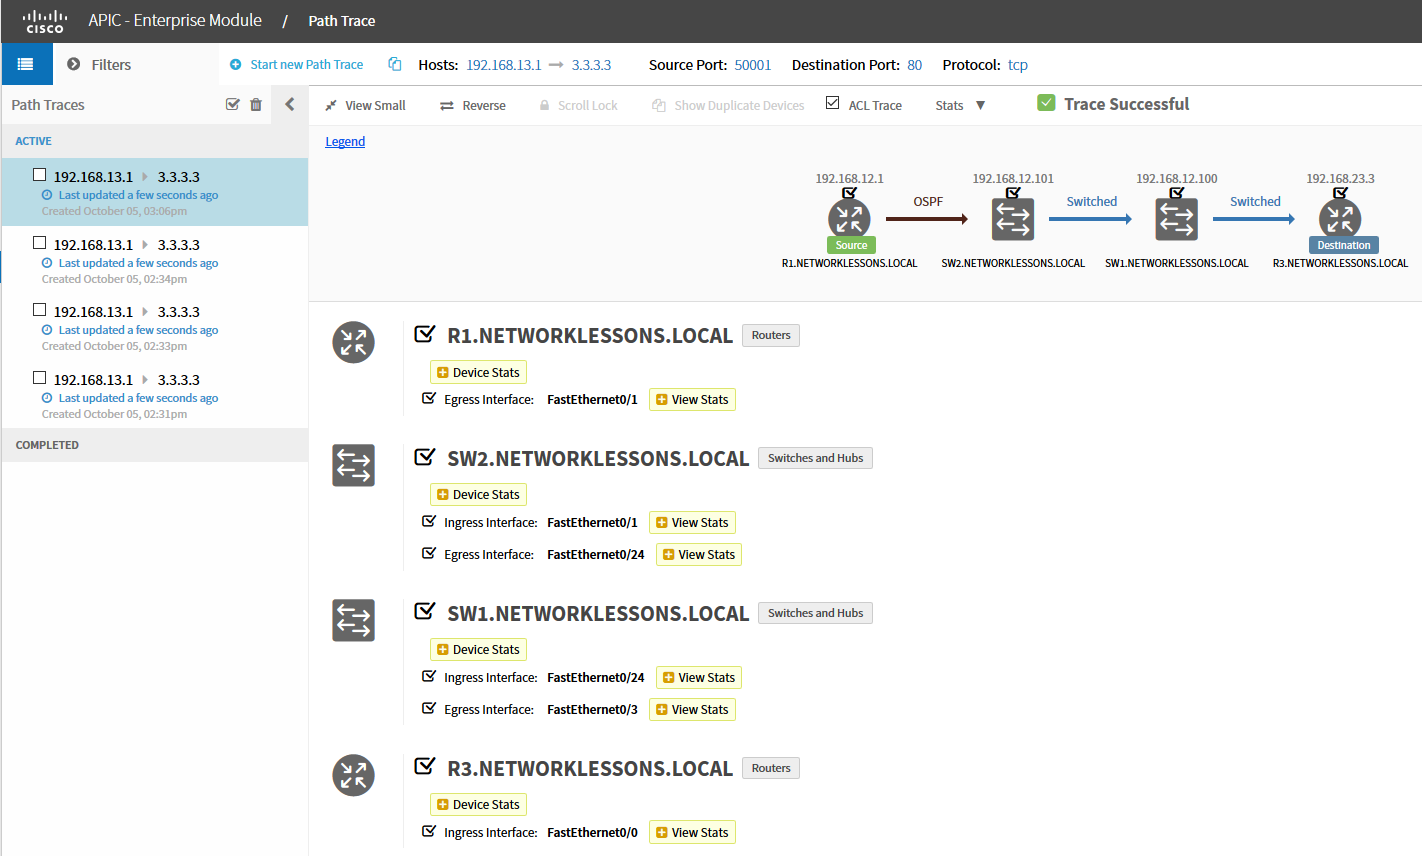
The output above is pretty neat. It tells us that R1 has used OSPF to determine how to reach 3.3.3.3 and that SW1 / SW2 are switching this traffic towards R3. This trace is successful since there is nothing blocking our traffic.
Let’s change this, to do this I will add an access-list on SW1 that blocks traffic to TCP port 80 from R1:
SW1(config)#ip access-list extended R1_R3_HTTP
SW1(config-ext-nacl)#deny tcp host 192.168.13.1 host 3.3.3.3 eq 80
SW1(config-ext-nacl)#permit ip any any

SW1(config)#interface FastEthernet 0/24
SW1(config-if)#ip access-group R1_R3_HTTP in
Once I added the access-list, it took a
few minutes before APIC-EM reread the configuration of SW1 and showed
the correct result in the path trace.
Let’s try it again: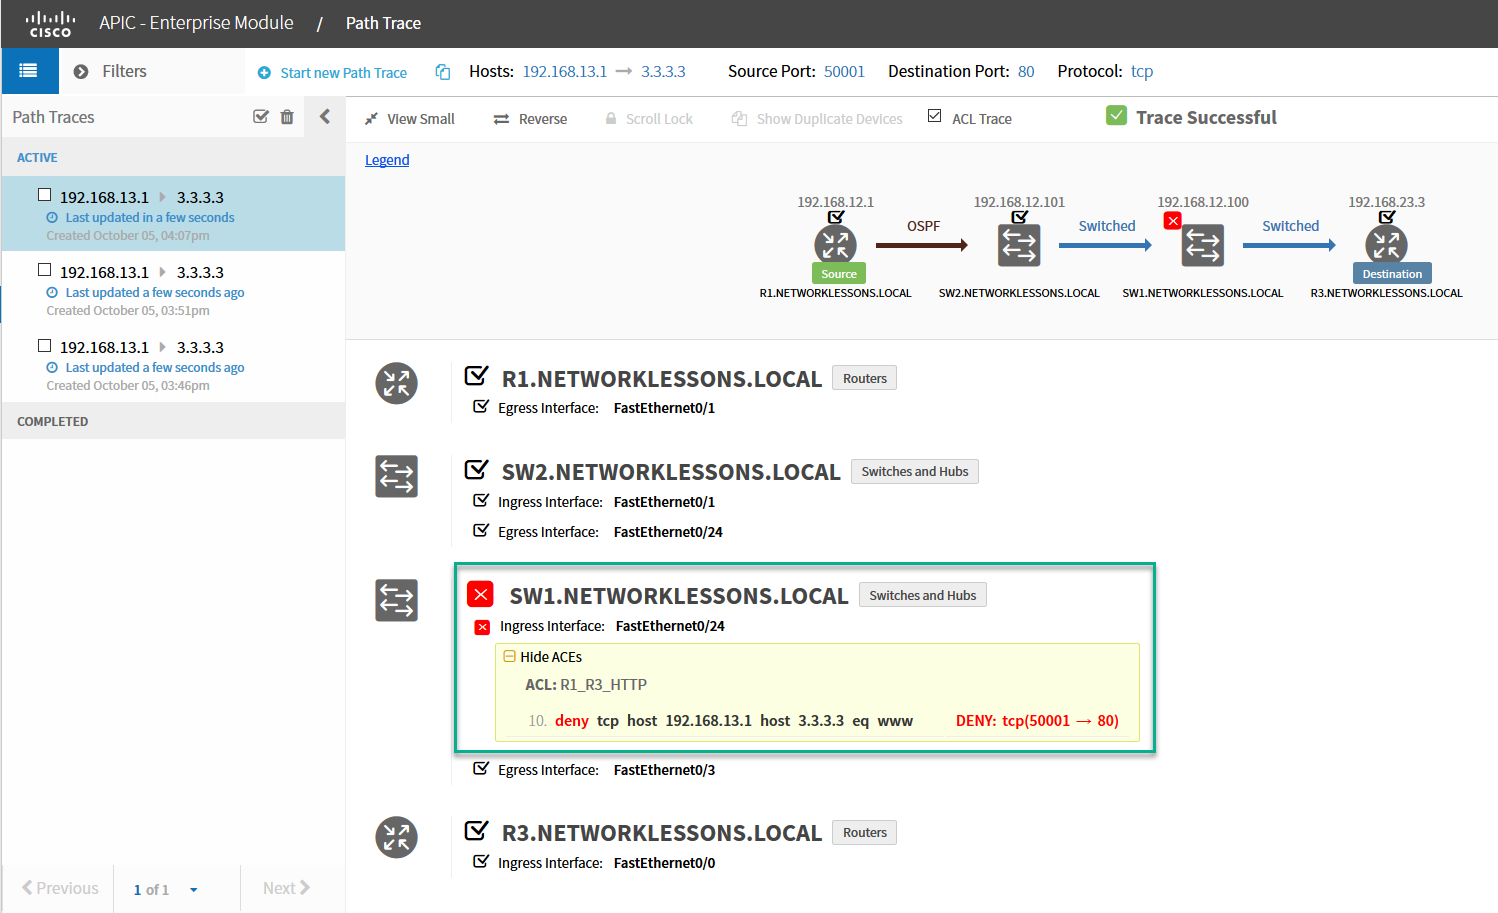
Excellent! As you can see above, this trace is failing because the access-list on SW1 is blocking our traffic. The cool thing is that APIC-EM not only tells us why it fails but also which access-list and line are responsible for this.
Hiç yorum yok:
Yorum Gönder